
User Journey Analytics: See Where Visitors Drop Off
TL;DR
- User journey analytics shows the pages visitors view in order, from entry point to exit point.
- You can track user activity on a website without cookies by counting page paths per session.
- Pulse Analytics Journeys shows visitor paths across 2 to 6 steps, with drop-off between steps.
- Use paths to find friction, then confirm each fix with funnel analysis.
Your pricing page gets visitors. Few of them sign up. Your dashboard shows the page views, but it cannot tell you what each visitor did before or after that page. User journey analytics closes that gap.
It shows the pages visitors view in order, from entry point to exit point. Pulse Analytics adds it to the Journeys report, and it works without cookies. This guide shows you how to read your visitor paths and fix the pages where visitors leave your site.
What Is a User Journey in Website Analytics?
A user journey is the sequence of pages and actions a person completes on a website to reach a goal. It starts at an entry point such as a landing page. It ends at a conversion or an exit point.
A website user journey covers only what happens on your site. A customer journey covers every touchpoint, including ads, email, support calls, and CRM records. Customer journey analytics joins those sources, so it needs data about individual people. User journey analytics does not.
User Journey vs Customer Journey vs Journey Map
| Term | Scope | Data it needs |
|---|---|---|
| Website user journey | Pages in one visit | Page paths per session |
| Customer journey analytics | All touchpoints over time | Individual profiles, often a CRM |
| Journey map | A diagram of expected steps | Research, interviews, and user testing |
A journey map shows the path you expect. User journey mapping from analytics shows the path visitors take. Compare both. The gap marks your pain points.
Stages of a Website Visitor Journey
- Entry: A first-time visitor or a returning visitor lands on the homepage, a blog post, or a feature page.
- Engagement: The visitor reads documentation pages or product pages.
- Decision: The visitor checks the pricing page or a comparison page.
- Action: The visitor completes a signup, activates a trial, makes a purchase, or submits a form.
- Exit: The visit ends on the last page viewed.
A smooth journey has few steps between entry and conversion. Each extra step adds barriers. Nielsen Norman Group reports that visitors decide within the first 10 seconds (opens in a new tab) whether to stay on a page.
User Journey Analytics and User Path Analysis Explained
User path analysis reads visitor paths as data. You pick a starting page. The report counts the next page, then the page after that. The result ranks user paths by volume.
Visitor paths answer questions that pageview totals cannot:
- Which pages send visitors to your pricing page?
- Where do visitors go after a blog post?
- Which entry points lead to signup?
- Where do visitors loop between two pages?
- Which exit point appears most often?
Conversion path analysis reverses the view. You start at the conversion and trace the pages that led to it, working backwards. Path reports also support open-ended exploration when you have no hypothesis yet.
Journey Analytics vs Funnel Analysis vs Session Replay
| Method | Question it answers | Data it needs |
|---|---|---|
| Path analysis | Where do visitors go next? | Page order within a session |
| Funnel analysis | Do visitors finish the steps you defined? | Defined steps and drop-off between steps |
| Session replay and heatmaps | What did one visitor do on a page? | Clicks, scrolls, and recordings per person |
Start with paths. They show routes you did not plan. Then build funnels for the route that matters. Plausible makes the same split in its docs. Funnels measure a flow you defined. Journeys reveal flows you did not expect.
Website Visitor Data That Feeds Journey Analysis
Journey reports need few fields. Visitor analytics works best when you collect the same fields every time. The web analytics guide lists the core metrics.
Entry Points and Exit Points
Entry points show how visitors arrive. Exit points show where visits end. Compare the two lists. A landing page that is also a top exit point signals a mismatch between the promise and the page.
Traffic Source and UTM Campaign
Traffic source names the channel. Examples include Google search, organic search, paid campaigns, a newsletter, social media, and an advertisement. A recommendation in an AI-generated answer counts too.
Tag campaign links with a UTM campaign parameter. Pulse offers a free UTM builder.
Device and Country
Filter by dashboard dimensions such as device and country. Compare mobile and desktop paths. A difference between segments points to a layout or navigation problem.
Data You Should Leave Out
Journey reports do not need names, emails, or personal profiles. Pulse is privacy-friendly analytics. It sets no cookies and builds no fingerprint. It makes a one-day identifier from the IP address and browser string with a random key that is deleted shortly after the site’s day ends.
User Journey Tracking Methods Compared
Three methods dominate user journey tracking. Each records different data and carries a different limit.
| Method | What it records | Main limit |
|---|---|---|
| Cookie-based tracking | Pages and events tied to a browser identifier | Consent banners and ad blockers remove visitors from the data |
| Session replay and heatmaps | Clicks, scrolls, and recordings | Captures detailed behavior of individual visitors |
| Cookieless path tracking | Page order within a session | No profile across days or devices |
Track User Activity on a Website in 4 Steps
To track user activity on a website, follow four steps. Set a goal, install one script, read paths, and fix the largest drop-off.
- Set one conversion goal. Pick a sign-up, trial activation, purchase, or contact sales request. Use a pageview goal on the thank-you page or a custom event on the contact form. Then track the conversion rate.
- Install one script tag. Paste this line inside the head section of every page. Use your site-wide layout, or your site builder’s header code setting.
<script defer data-domain="yoursite.com" src="https://js.ciphera.net/script.js"></script>
- Set depth and paths. Pulse opens at a depth of 4 with 20 paths per step. Change both after your first read.
- Add an Entry page filter. Follow journeys that began on one page. Read the drop-off, change one element, and compare the same date range later.
The installation guide shows the same tag. Framework steps are on the integrations page.
The Pulse script is under 3 KB gzipped and loads deferred, so it never blocks rendering. Google’s gtag.js is over 150 KB gzipped.
Visitor Path Analysis in Pulse Analytics
Pulse Analytics includes Journeys on every plan, including the free Personal plan. The report shows “How visitors navigate through this site” as a step-by-step flow.
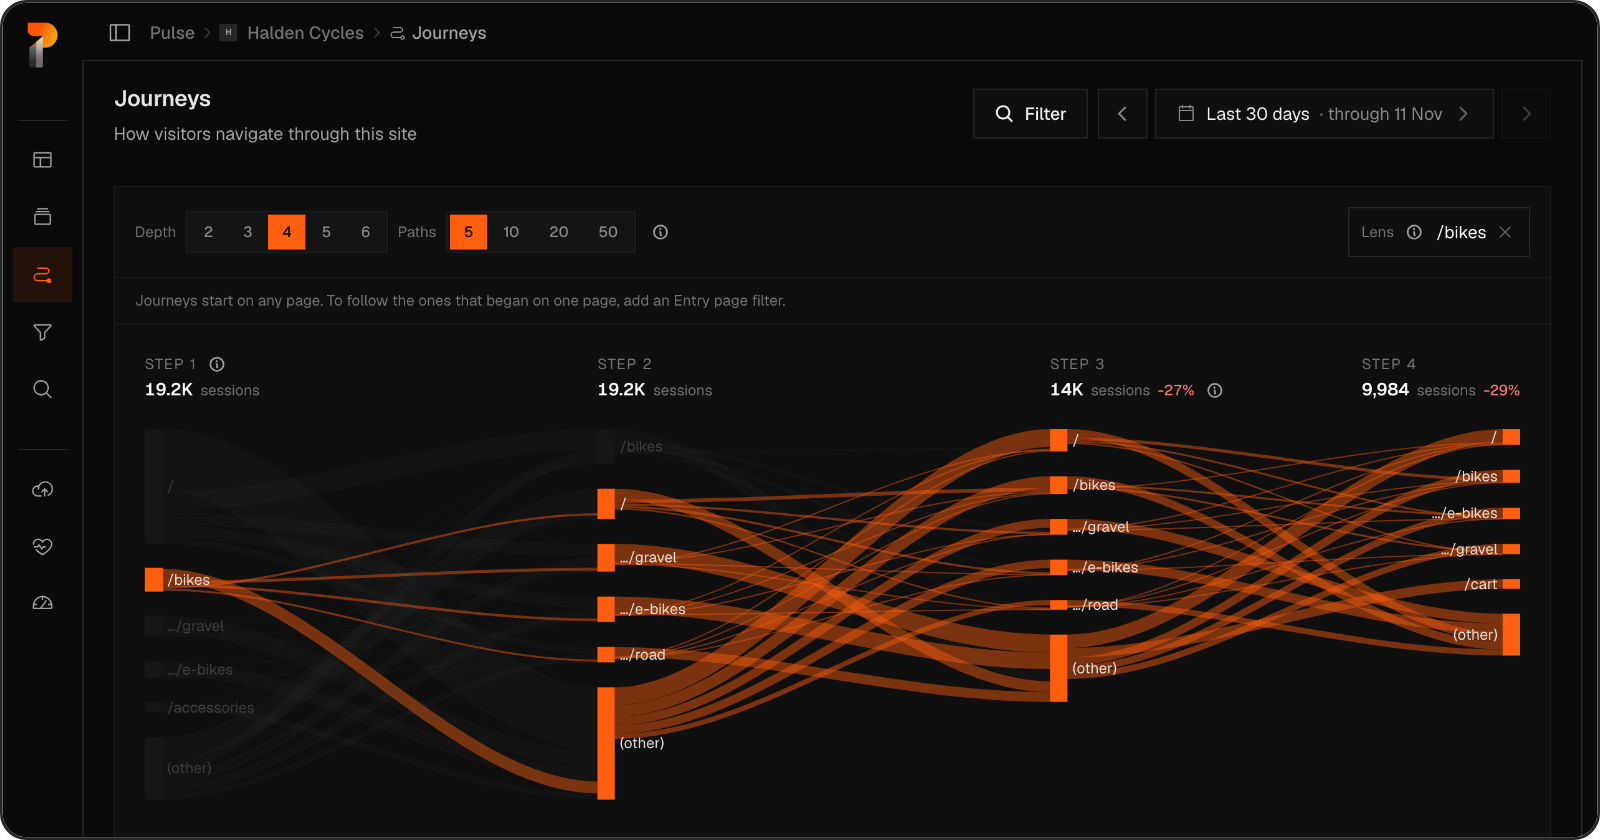
Depth, Path Count, and Flow View
- Depth sets the number of steps shown: 2, 3, 4, 5, or 6.
- Paths sets how many pages Pulse names in each step: 5, 10, 20, or 50. Remaining pages group under (other).
- Flow bands connect the steps. A wider band carries more sessions.
Drop-Off Between Steps
Each step shows its session count. From step 3, Pulse shows the change from the previous step: red where visitors drop off, green where paths converge. That percentage is the drop-off between steps.
The footer lists sessions tracked, steps shown, and any hops from (other) to (other) that the flow does not draw.
Entry Page Filter and Other Filters
Journeys start on any page. Add an Entry page filter to follow journeys that began on one page. You can also filter by country, device, or referrer. Agencies can share a public dashboard link with clients.
Data Pulse Tracks and Data It Leaves Out
Pulse records:
- Page paths and session counts per step
- Referrers and UTM campaigns
- Device and country
- Custom events, outbound link clicks, and file downloads, which count as events on your plan
- With the optional interactions script: clicks on buttons and links, copies, and form submissions
Pulse leaves out:
- Cookies, fingerprints, and personal profiles
- Per-person history beyond a day, so a visitor who returns next week appears as a new visit
- Session replay and heatmaps
- Cross-device tracking, so one person on a phone and a laptop may count twice
- Mobile app tracking, because Pulse covers web only
Pulse does not replace Google Analytics for Google Ads remarketing or BigQuery export. Choose GA4 for those needs. The Pulse vs Google Analytics comparison and Pulse vs Plausible comparison pages list each trade-off.
User Path Analysis Examples With Fixes
Each example follows the same order: signal, likely cause, action.
Blog Post to Signup Path
SaaS teams and content and SEO teams see this often. Readers enter on a blog post and leave from the same post. The call to action sits too low or does not match the topic. Move the CTA higher and link to the feature page.
Pricing Page Loops
Visitors move between the pricing page and a comparison page, then leave. The page lacks trust signals or clear plan limits. State the limits and add one clear button.
Checkout Drop-Off for Ecommerce Stores
Product pages lead to the cart but not to the confirmation page.
Baymard Institute (opens in a new tab) puts average cart abandonment at 70.22%, based on 50 studies. Among US shoppers who abandoned a cart for reasons other than browsing, 40% cited extra costs. Another 18% cited forced account creation, and 17% cited a long or complicated checkout.
Ecommerce stores can show the total cost early, offer guest checkout, and shorten forms.
404 Page and Category Page Exits
Visitors reach a 404 page or a category page and exit. Add a search box and links to top category pages and the homepage.
Website Architecture Fixes from Visitor Paths
Information architecture decides how pages connect. Compare real visitor paths with your sitemap and website architecture.
- A deep content sitemap hides key pages behind many clicks. Move them closer to the homepage.
- Unclear menus send visitors to the wrong page. Rename main menu items and navigational elements.
- Weak internal linking leaves feature pages unreached. Link to them from blog posts.
- Weak page structure gives visitors no next step. Add clear headings, structured content, and buttons.
Friction usually comes from unclear menus, long forms, slow pages, and unexpected costs. Path data shows where it happens. User testing and task-based testing show why. Website teams should run both.
Mistakes That Distort User Journey Data
- Reading a path as intent. A path shows what visitors did, not why.
- Skipping a baseline. Compare equal date ranges before and after a change.
- Starting too deep. Begin at a depth of 4, then widen.
- Ignoring (other). Raise Paths to 50 to name more pages.
Turn Visitor Paths Into Better Website Experiences
Understanding where visitors go is only the first step. The real value comes from identifying where they drop off and making improvements based on actual behavior.
Use Pulse Analytics Journeys to explore visitor paths, identify navigation friction, and understand how people move through your website.
Start with the free Personal plan and discover where your visitors go next. See every plan on the pricing page.
FAQ
Frequently Asked Questions
User journey analytics measures the order of pages visitors view, from entry point to exit point or conversion.
Path analysis finds the routes visitors take. Funnel analysis measures drop-off between steps you define.
Install a cookieless script that counts page paths per session without cookies or fingerprinting.
Compliance depends on what you collect. Pulse sets no cookies, builds no fingerprint, and keeps no personal profile.
Website visitor data covers pages viewed, traffic source, device, country, and time. Journey reports need page order most.
Yes. Privacy-first tools such as Pulse Analytics and Plausible Analytics offer path reports.
Related Articles



Get started
Try privacy-first analytics free
The Pulse script is about 3 KB and sets no cookies. Start on the free Personal plan, or explore the live demo first without signing up.